Today, we look at why climate risk and consequence overcost have similarities.
Have you ever been involved in a project whose final budget exploded due to apparently negligible schedule or material risks? Similarly, even if the changes we record in weather averages are small, they are having big impacts. Let’s find out why this happens.
Probability of Overcost vs. Likelihood of Event
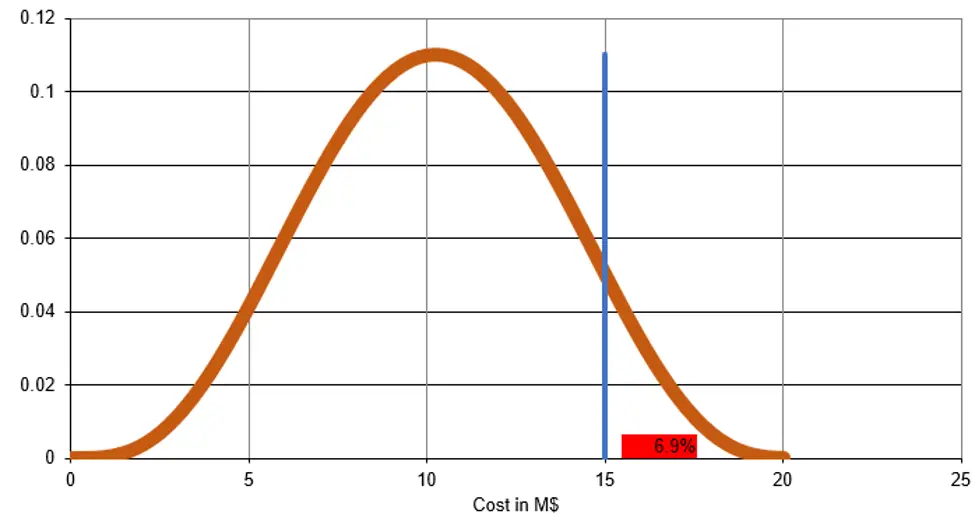
Let’s suppose the consequences of a risk scenario vary between $0 and $20M with an average of
$10M and a standard deviation of $3M. Management was clear that anything over $15M was unacceptable, based on their tolerance threshold at 0.05 likelihood.
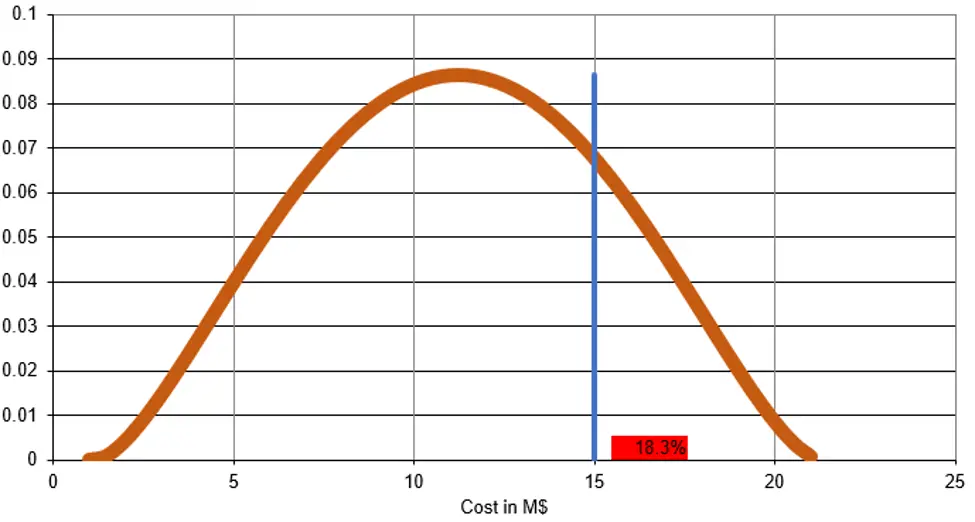
Based on the “distribution” of the consequence described above, we can compute the probability of the consequence to be higher than the $15M threshold. It is the area right of the blue line under the orange curve in the figure below.
The probability of an event costing more than $15M (i.e. the overcost probability) is 6.9%, given the assumed distribution of consequences.
The likelihood of an event costing $15M given the distribution described above is 0.05% as readable on the Y-axis.
Climate Change Probability of Extreme Events
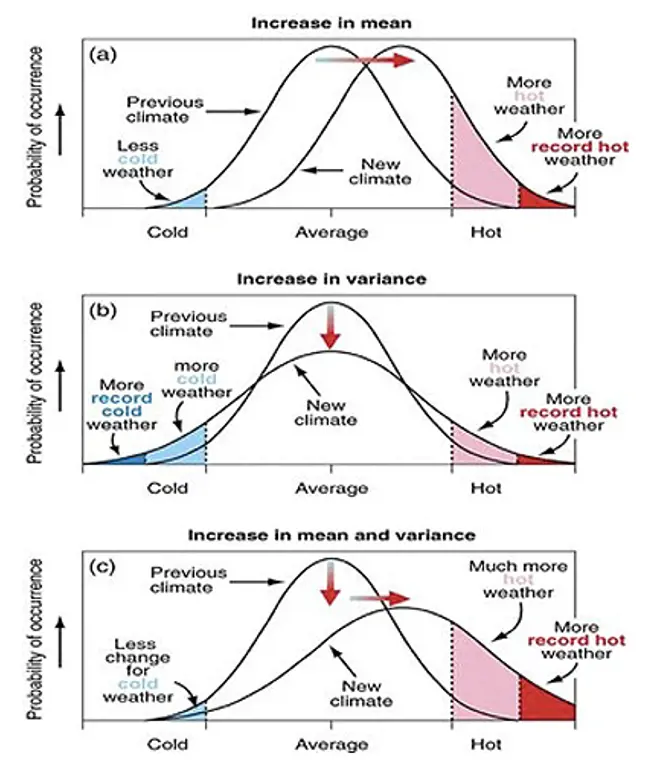
The Intergovernmental Panel on Climate Change (IPCC) (Figure 5: IPCC (2001)) graph below illustrates how a shift and/or widening of a probability distribution of temperatures affects the probability of temperature extremes and of more “standard hot or cold” weather.
Risk Scenario Overcost
Now if we look at the risk scenario we introduced above, we can calculate how small changes in average consequences can lead to dramatic change in costs.
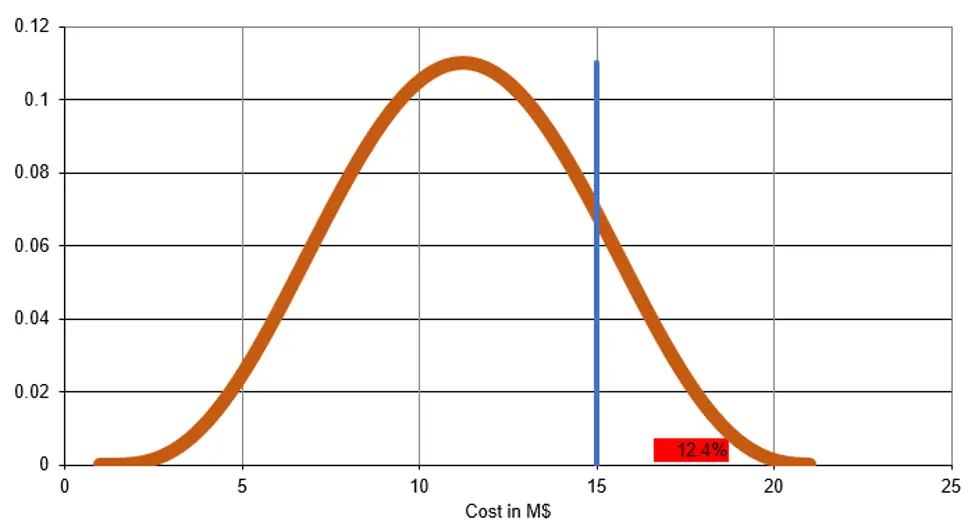
Let’s follow the IPCC case (a), e.g. shift the distribution to the right by $1M.
This leads the event to have a likelihood of 7% of costing $15M and an overcost probability of 12.4%. That is roughly twice the value of the initial state. The event would also be intolerable if the tolerance was at 0.05, $15M.
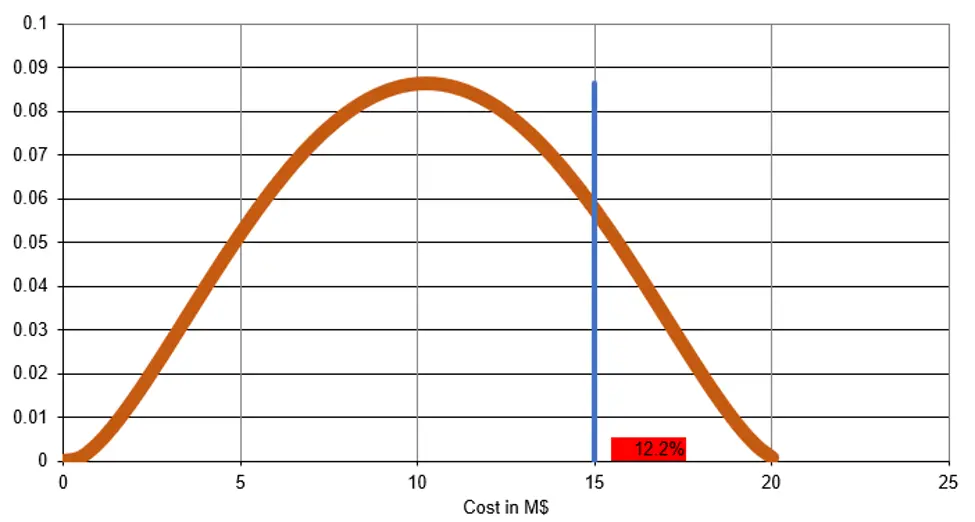
We can look at case (b) of the IPCC, e.g. maintain the average at $10M, but increase the standard deviation to $3.5M. The overcost probability also increases to almost double the initial state.
In IPCC case (c), we combine the two prior cases, i.e. shifting and increasing volatility. The result is staggering: almost 20% probability of overcost.
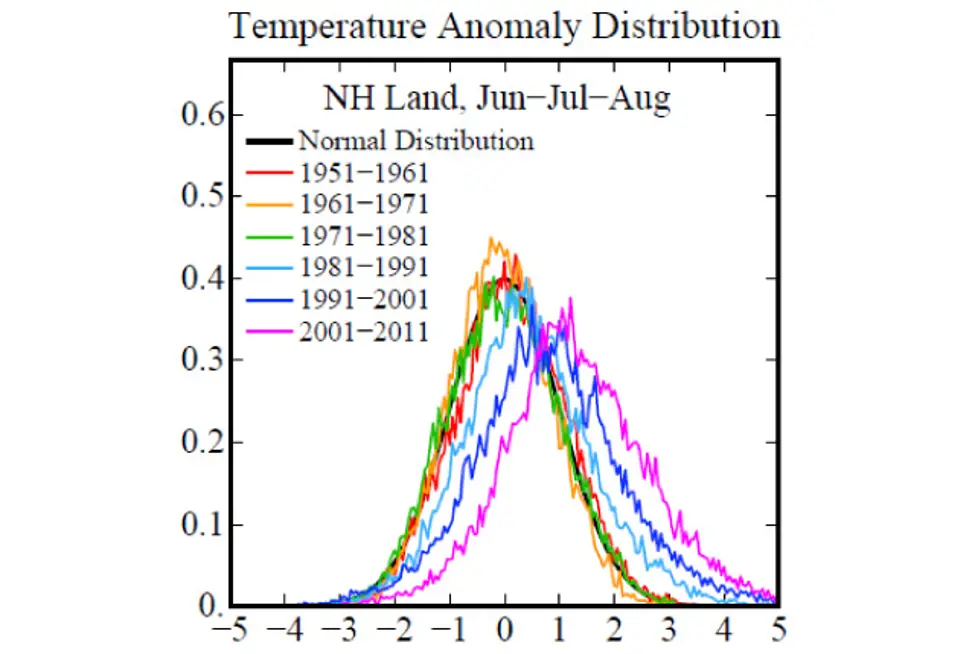
In real life, we can see many records showing “small” increases in variance and mean as exemplified in the image below from NASA/Hansen et al. (2012).
Frequency of summer temperature anomalies: How often they deviated from the historical normal of 1951−1980 over the summer months in the Northern Hemisphere.
Why Climate Risk and Consequence Overcost Have Similarities
Finally, armed with the tools we discussed above, we can also explain why “small” increases in variance and mean lead to the “explosion” of costs of consequences. No need to look at extreme events we are experiencing today: Small changes in mean and volatility will also lead to staggering consequence increases. If a risk assessment neglects to consider shifts of distributions and increase volatility, it will mislead users on the risk tolerance of climate change events.

