International mineral disclosure standards inform stakeholders about exploration results and resource and reserve estimates. The definitions within these standards facilitate the assessment of pre-development projects.
The feedback now presented addresses the relative reported proportions of Measured, Indicated and Inferred mineral resource at project pre-feasibility study (PFS) and feasibility study (FS) levels.
Industry Practice: Survey
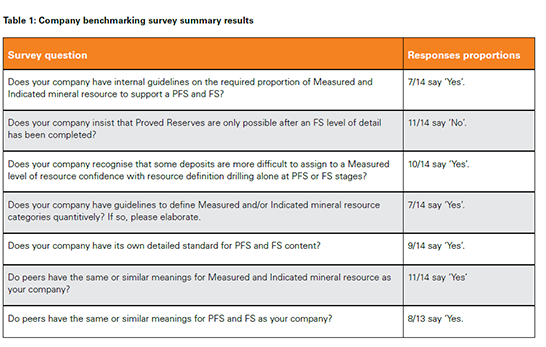
The authors created an international benchmarking survey. The survey was circulated to relevant professionals at 21 mining companies. Invitees were asked to provide their company’s view on the topics surveyed, not their personal opinions. Responses were received from 14 companies. The key questions and results are summarised in Table 1.
Review of Public Data
An April 2021 review of public data also considered a private database collection of public reporting data, which was filtered to companies with a market capitalisation (MCap) of <US$200 billion.
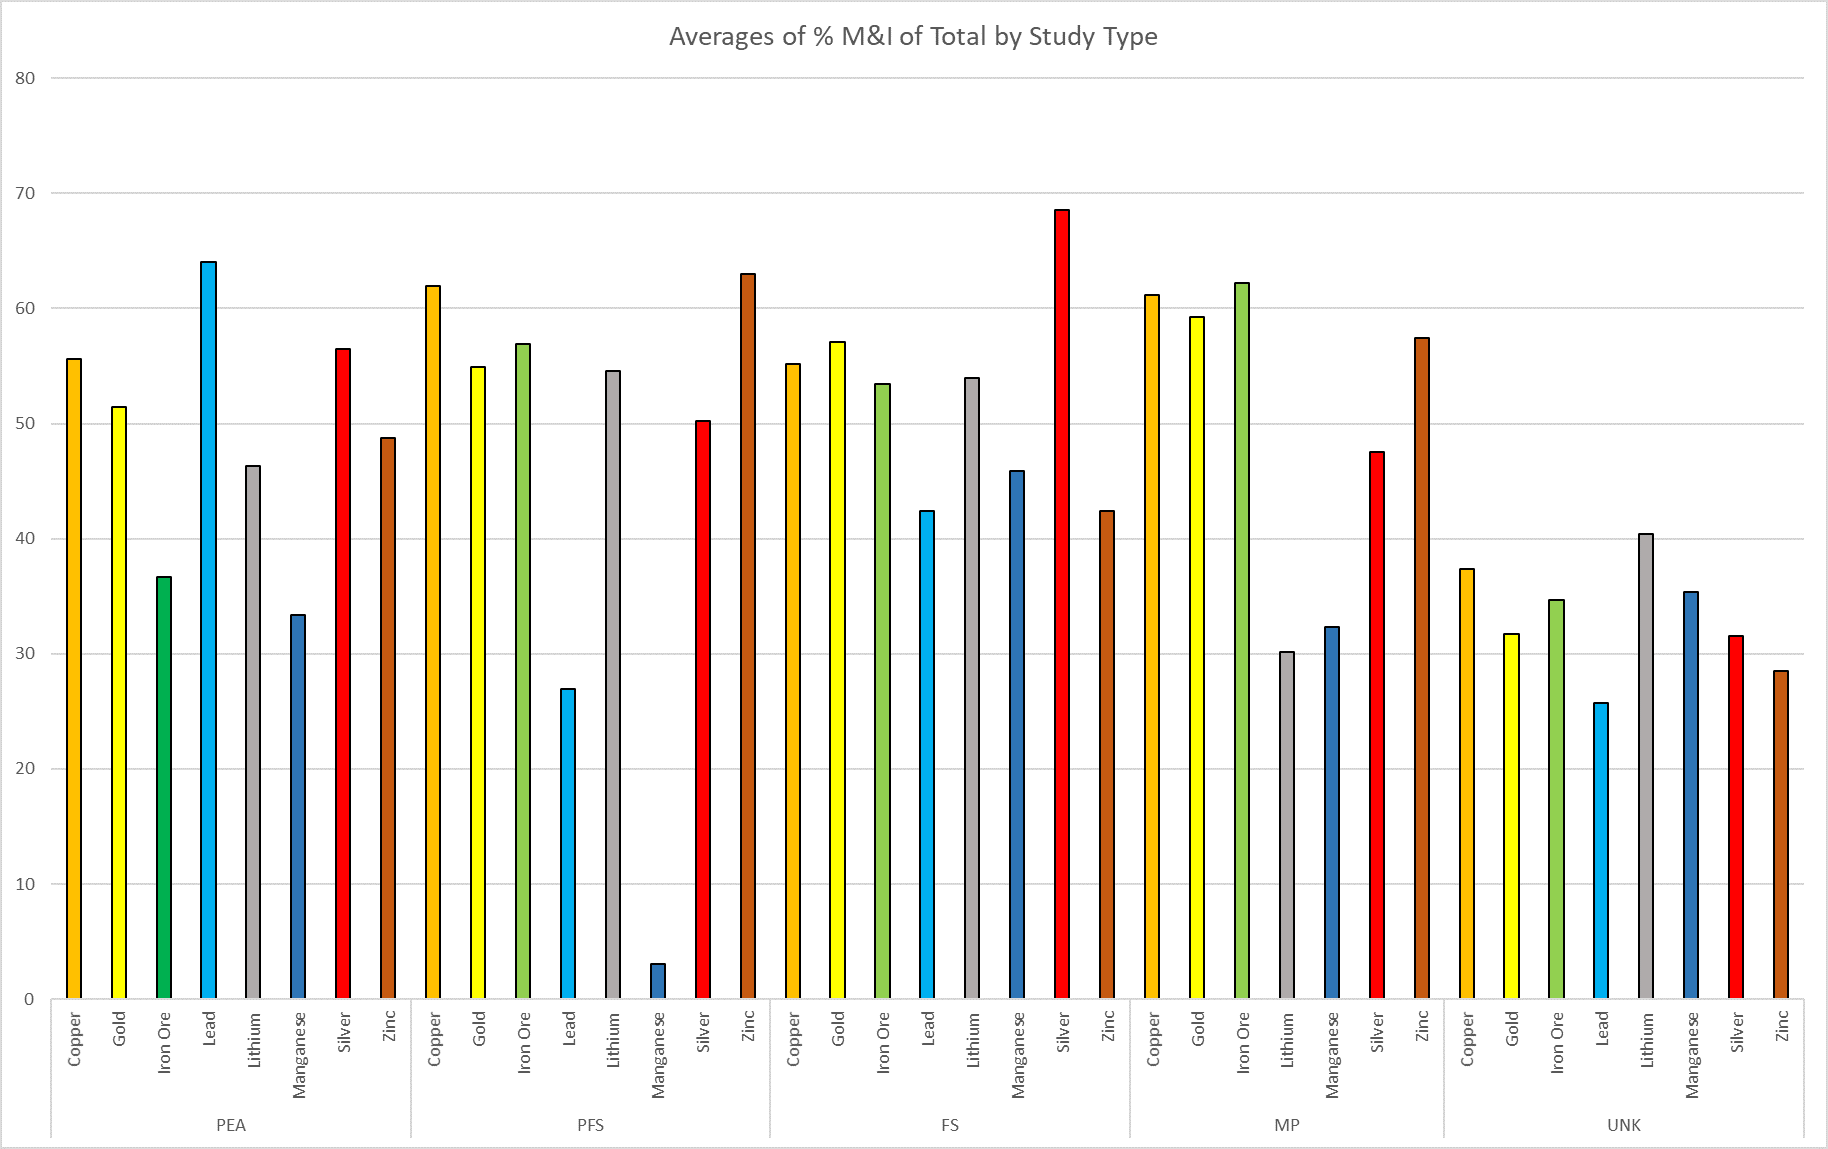
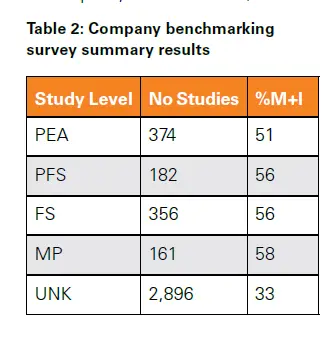
Figure 1 shows the percentage of Measured plus Indicated (M+I) mineral resource material for various commodities at differing levels of study. These results suggest there is little increase in the proportion of M+I to total mineral resources as the
study level increases. These results are summarised in Table 2 (PEA – preliminary economic assessments, MP – mine plans, UNK – unknown).
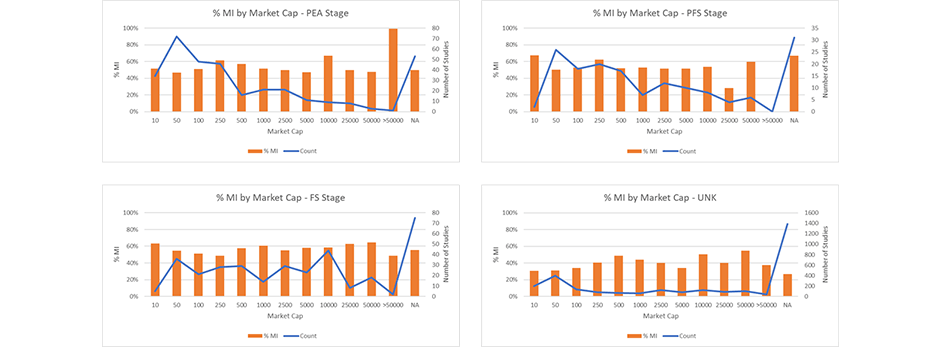
Figure 2 suggests there is no relationship between MCap and the percentage of
M+I to total mineral resources reported.
Conclusions
Review of public data and the feedback from the industry survey provide similar results and indicate inconsistency in the approaches applied and subsequent outcomes.
The risk-averse survey invitees held predominantly bulk commodity deposits and have internal guidelines for resource categories required to inform PFS and FS and generally require Proven Mineral Reserves over the payback period. They typically believe industry peers have similar meanings for resource categories and PFS and FS levels.
The risk-tolerant invitees typically held projects with greater geological complexity. This group generally has detailed internal standards for PFS and FS content, and believe peers have materially different meanings for resource categories and PFS and FS levels.
The authors propose that lender and investor evaluations further influence the industry approaches reported here, which may warrant further review.


