Sensitivity analysis is an important part of project evaluation, but in many cases it is given insufficient time and effort. In such cases, the overall analysis of a project’s financial metrics suffers.
Under a deterministic approach, the impact of changes in key valuation assumptions can be assessed by changing one assumption independently of all other assumptions, which remain constant. In this example, four parameters in a cashflow are analysed: coal calorific value (CV), total operating costs, capital expenditure, and sales production tonnages. Each assumption is either increased or decreased by 10% and 20% to determine the impact on the project’s value in the graphs above.
This analysis shows that the project is most sensitive to changes in coal CV
and sales production tonnage. Operating costs and capital expenditure have less impact on project net present value (NPV).
Sensitivity analysis often stops at this point. However, this approach does not tell us anything more than the input parameter the NPV is most sensitive to. In a stochastic approach, all parameters may be simultaneously varied to assess the impact on the project’s cashflow value. In this example, a uniform distribution was adopted to simulate changes in operating and capital costs, but truncated to prevent unreasonable values. A normal distribution was used to model changes in coal CV and sales production tonnage.
Monte Carlo simulation can generate and assess many scenarios, producing a distribution of NPVs, as illustrated in the bar charts above. This distribution can then be used to quantify the probability of an unsatisfactory NPV outcome (that may be negative) with a specific set of coal CV, costs and sales production assumptions. This NPV outcome represents the ‘value-at-risk’ (VAR).
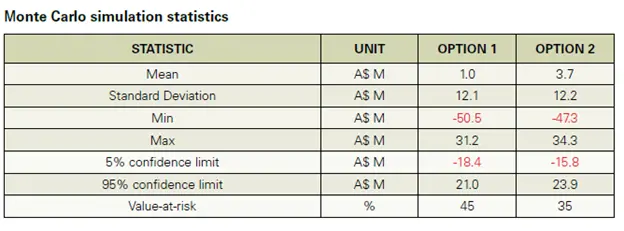
In this example (below), the simulation suggests that there is a 45% probability of returning a negative NPV in the case of Option 1. However, in the case of Option 2 when certain upfront capital expenditure is provided by a contractor miner, the VAR is
only a 35%. This example shows how a reallocation of capital costs from owner to contractor may have limited impact on NPV distribution, but a major impact on VAR and the expected value of NPV (mean) as shown in the table below.

