Careful continued geological ranking of targets within a company’s portfolio can aid in directing limited investment while reducing exploration risk and aid in communicating an exploration strategy to upper management and investors.
Understanding Comparative Transactions
A 100,000 troy-ounce gold project in one of Western Australia’s prime gold fields can double or halve in value from one year to the next. This is because, despite the technical value of that project remaining the same, it is only worth what someone will pay for it. The market value is driven by external factors including investor sentiment, political situation, tax incentives, commodity price, and availability of infrastructure.
The comparative transactions method of valuing projects is well understood and very simple. Like selling a house, look for houses on the same street, with the same number of bedrooms and bathrooms, that have sold recently. The same concept applies to mining and exploration projects, yet it isn’t always adhered to. For example, there are valuations where gold projects are the basis being used to value copper, lead or zinc projects, or where operational mines are used to value early exploration stage projects. That’s like using an apartment block to value a detached home.
In reality, applying a consistent and rigorous methodology to every valuation provides the most accurate valuations. Transactions should be researched and identified every time with shared commodity type, development stage, mineralisation style, and mining type. The transaction details should also be vetted to ensure the dollars paid and the implied dollar per tonne are not inflated by royalties, offtake agreements, or contingent options. Then, normalise these datasets to market conditions at the valuation date for comparison. Where a transaction is not transparent enough it should be excluded. These logical steps are clearly delineated in the real estate markets but commonly not applied in the mining sector.
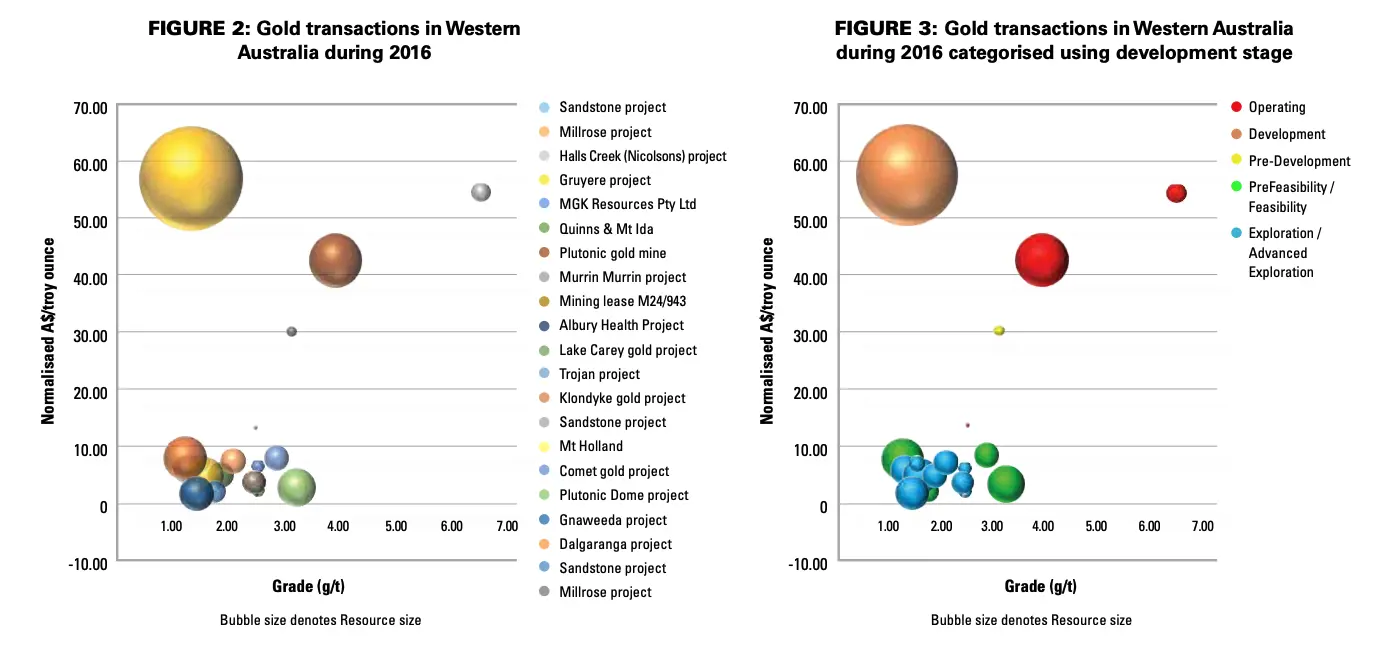
Graphical and statistical analysis of these transactions can spot outliers or explain anomalous values. Figures 2 and 3 graph transactions involving gold projects with Resources in Western Australia during 2016. Initially, without context (Figure 2), we see examples of how large tonnage, low grade projects can be acquired at a similar cost, on a dollar per troy-ounce basis, to small tonnage, high grade projects. The remaining clustered data points are less enlightening. However, with context (Figure 3), by categorising using development stage, the picture is clearer. Disparities can be highlighted, despite similarities in total ounces and grade.


